
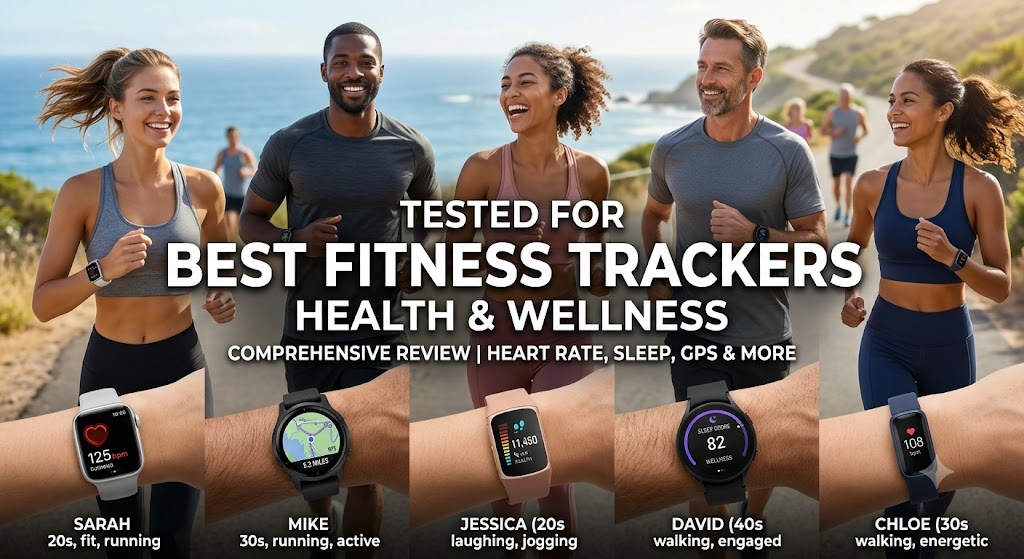
The consumer wearable market has undergone a fundamental transformation over the past five years. Where early fitness bands were little more than glorified step counters with rudimentary accelerometers, modern devices function as sophisticated physiological data collection platforms. Today’s top fitness trackers monitor everything from autonomic nervous system tone via heart rate variability (HRV) to peripheral capillary oxygen saturation, estimated skin temperature deviations, and real-time electrocardiogram (ECG) waveforms.
Yet, more data does not automatically yield better health outcomes. The influx of raw metrics has introduced significant consumer confusion. Many users find themselves paralyzed by inconsistent sleep stage graphs, inaccurate calorie expenditure estimates, and arbitrary “readiness” scores that fail to correlate with their actual physical state. Choosing the right tracker requires looking past glossy marketing materials and understanding the biomechanics of optical sensors, the math behind proprietary recovery algorithms, and the practical usability of the hardware on a day-to-day basis.
To identify the best fitness trackers for health and wellness, we evaluated the leading market options across critical performance vectors: photoplethysmography (PPG) accuracy during resting and dynamic states, sleep staging correlation against polysomnography standards, recovery metric utility, long-term software support, and hardware reliability.
The Physiology and Mechanics of Wearable Sensors
To evaluate any fitness tracker fairly, one must understand how these devices extract biological signals through human skin. Consumer wearables rely primarily on photoplethysmography (PPG). This optical technique involves shining light-emitting diodes (LEDs)—typically green, red, or infrared—into the dermal and subcutaneous tissue layers. The photodiode sensor adjacent to the LEDs measures the intensity of light reflected back or transmitted through the tissue.
Because blood absorbs light more readily than the surrounding tissues, each cardiac cycle alters blood volume in the local arterioles, modulating the reflected light signal. While resting heart rate can be detected with high precision using standard green LEDs, dynamic movement introduces massive motion artifacts. When you run, lift weights, or cycle over rough roads, the sensor shifts over the skin, and muscle contractions create fluid shifts that mimic arterial pulses. A common failure mode known as “cadence lock” occurs when the device’s signal processing algorithm mistakes rhythmic footsteps for the heartbeat, reporting a heart rate of 165 beats per minute when the user is actually at 130.
High-end trackers mitigate this issue using multi-channel sensor arrays, high sampling frequencies (measured in Hertz), and sophisticated digital signal processing (DSP) algorithms that filter out movement detected by onboard accelerometers and gyroscopes. Understanding this optical limitation is essential: even the best wrist-based trackers can experience latency during rapid heart rate spikes—such as during high-intensity interval training (HIIT)—compared to electrocardiography chest straps that measure electrical impulses directly at the myocardium.
Beyond heart rate, modern trackers leverage red and infrared sensors for pulse oximetry (SpO2), electrodermal sensors (cEDA) to measure microscopic sweat gland changes related to sympathetic stress, and passive temperature sensors that measure relative skin temperature shifts relative to a baseline during sleep.
Garmin Venu 3: Best Overall for Comprehensive Health and Longevity
The Garmin Venu 3 represents the pinnacle of balancing lifestyle features with deep athletic and physiological insights. While Garmin built its reputation on rugged, utilitarian devices for ultramarathoners and triathletes, the Venu series addresses the everyday user who wants advanced health metrics wrapped in a sophisticated, display-forward design.
Sensor Architecture and Hardware Performance
At the core of the Venu 3 is Garmin’s Elevate V5 optical heart rate sensor. This generation introduced additional green and infrared LEDs alongside a broader photodiode layout, noticeably reducing cadence lock during running and indoor rowing. The metal ring bezel also houses the necessary hardware for FDA-cleared ECG readings, allowing users to record an on-demand rhythm strip to check for signs of atrial fibrillation.
Battery longevity is where the Venu 3 consistently outclasses competitors like the Apple Watch. Even with its vibrant 1.4-inch AMOLED display set to medium brightness, the device reliably delivers 10 to 14 days of battery life in smartwatch mode, or 4 to 5 days if using the always-on display setting. This multi-day autonomy is critical for wellness tracking because it eliminates data gaps caused by daily charging cycles.
Software Ecosystem: Body Battery and Sleep Coaching
Garmin’s flagship recovery metric, Body Battery, translates HRV, stress, physical activity, and rest into an intuitive 1-to-100 energy reserve score. Unlike many black-box algorithms, Garmin calculates this dynamically throughout the day. If you sit through a high-stress meeting, you will see your stress baseline rise and your Body Battery drain faster, even while seated.
The Venu 3 also incorporates Garmin’s updated Sleep Coach, which analyzes historical sleep debt, daytime activity, and heart rate variability to suggest specific sleep durations. Rather than offering generic advice, it adjusts recommendations—telling you, for instance, to aim for 8 hours and 20 minutes tonight due to a strenuous workout or poor recovery the prior night. It also supports daytime nap tracking, correctly categorizing short rest periods without resetting your daily sleep statistics.
Limitations
While the Venu 3 supports smartphone notifications, quick replies (on Android), and voice assistant pass-through via its built-in microphone and speaker, its third-party app ecosystem remains minimal compared to watchOS or Wear OS. It is a health and performance computer first, and a smartwatch second.
Apple Watch Series 9: Best for Medical-Grade Precision and Daily Utility
For users within the iOS ecosystem, the Apple Watch Series 9 remains the gold standard for clinical-grade sensor accuracy and seamless operational convenience. Independent validation studies—including research published by the National Center for Biotechnology Information—consistently position the Apple Watch’s optical heart rate sensor and ECG functionality among the closest to clinical telemetry equipment.
Diagnostic Features and Cardiovascular Monitoring
The Series 9 relies on a refined optical sensor paired with an electrical heart sensor embedded in the Digital Crown and sapphire back crystal. Its accuracy during dynamic exercise is exceptional, matching telemetry chest straps across running, steady-state cycling, and functional strength work with negligible lag.
From a preventative health perspective, the device offers robust cardiovascular safety nets. It continuously screens background pulse patterns for irregularities suggestive of atrial fibrillation, provides high and low resting heart rate notifications, and features a certified ECG application. Furthermore, its Cardio Fitness metric calculates VO2 max estimates based on walking and running kinematics with surprising stability over multi-month periods.
Sleep Architecture and Sleep Apnea Tracking
Apple’s native sleep tracking relies on machine-learning models trained against overnight polysomnography (PSG) datasets. It provides detailed hypnograms dividing the night into Awake, Core (Light), Deep, and REM sleep. Apple has avoided proprietary recovery scores, opting instead to present raw data—resting heart rate, respiratory rate, wrist temperature deviations, and sleeping HRV—without dictating an arbitrary readiness percentage.
A recent update introduces breathing disturbance tracking using the onboard accelerometer to detect micro-movements associated with interrupted respiration, categorizing disruptions into Elevated or Not Elevated to help users recognize potential signs of moderate-to-severe sleep apnea.
The Trade-Off: Daily Charging
The single greatest drawback of the Apple Watch Series 9 remains its 18-to-24-hour battery life. Although fast charging allows the device to charge from 0% to 80% in approximately 45 minutes, building a consistent routine around charging before bed or while showering is mandatory. Missing a charge window results in missing an entire night of foundational physiological tracking.
Whoop 4.0: Best Screenless Device for Recovery and Athletic Periodization
Whoop approached the wearable problem from an entirely different philosophy. By eliminating the display entirely, the Whoop 4.0 transforms the tracker from a notification-heavy distraction into an unobtrusive physiological monitor designed to be worn 24/7 without interruption.
Focus on Strain and Autonomic Recovery
Whoop frames health tracking around two complementary axes: Strain and Recovery. Strain is calculated on a non-linear scale from 0 to 21, measured via cardiovascular load and muscular strain (detected through accelerometer tracking of mechanical load during resistance workouts). Unlike pedometers, Whoop does not count steps; a five-mile walk carrying a heavy pack registers as cardiovascular strain, appropriately reflecting the physiological toll on the body.
Every morning, Whoop delivers a Recovery Score (0% to 100%), split into Green, Yellow, and Red zones. This score is derived heavily from nocturnal heart rate variability (rMSSD calculation), resting heart rate, sleep performance against baseline sleep debt, respiratory rate, and skin temperature. When applied properly, it serves as an effective guide for periodizing training—signaling when an athlete can absorb high training volumes and when the central nervous system requires active rest.
Form Factor Versatility and continuous wear
Because the Whoop 4.0 is small, water-resistant, and lacks a screen, it can be mounted inside specialized bicep bands, sports bras, or compression shorts (Whoop Body) rather than worn exclusively on the wrist. This offers a distinct advantage for combat athletes, gymnasts, and lifters who cannot wear wrist-mounted hardware safely. Its slide-on battery pack enables users to charge the device while wearing it, ensuring true zero-gap data collection.
The Business Model: Perpetual Subscription
The primary barrier to Whoop is its subscription requirement. Rather than a one-time hardware purchase, users must pay an ongoing monthly or annual fee. Over a three-year span, the cost of membership significantly exceeds that of high-end smartwatches. For dedicated athletes, competitive runners, and individuals actively managing chronic fatigue or autoimmune conditions, the specialized recovery algorithms justify the cost; for casual fitness enthusiasts, it is often an unnecessary recurring expense.
Oura Ring Gen 3: Best Form Factor for Sleep and Temperature Tracking
The Oura Ring Gen 3 addresses the growing segment of consumers who refuse to sleep with a bulky wristwatch or who prefer wearing traditional mechanical timepieces during the day. Weighing mere grams and crafted from titanium, the ring houses infrared and red LEDs, negative temperature coefficient (NTC) thermistors, and an accelerometer inside a smooth interior resin molding.
The Arterial Advantage
The finger offers distinct physiological advantages over the wrist for optical data collection. The palmar digital arteries run close to the surface of the skin on either side of the finger, covered by a thinner epidermal layer than the top of the wrist. This vascular architecture allows the Oura Ring to capture exceptionally clean resting heart rate and HRV data overnight.
Oura’s temperature tracking is among the most sensitive on the consumer market, measuring changes against the user’s personal baseline in increments of 0.1°C. This makes the ring an exceptional tool for two specific use cases: illness detection and female cycle tracking. A sustained elevation in night-time skin temperature often appears 24 to 48 hours before subjective symptoms of a systemic viral infection manifest. For women, this temperature resolution facilitates accurate tracking of follicular and luteal phases, integrating directly with cycle-tracking platforms like Natural Cycles.
Daytime and Activity Constraints
While Oura excels at passive overnight recovery tracking, it struggles as a dedicated workout companion. The ring lacks a screen for real-time pacing, cadence, or heart rate zone monitoring. Furthermore, performing barbell deadlifts, pull-ups, or dumbbell presses while wearing a metal ring is uncomfortable and carries a risk of ring avulsion or damage to the titanium coating. While Oura allows workout heart rate tracking for running and cycling, it remains primarily a recovery, sleep, and lifestyle health tool.
Fitbit Charge 6: Best Budget-Conscious Health Band
For individuals who want comprehensive health telemetry without spending hundreds of dollars on a luxury smartwatch, the Fitbit Charge 6 remains the most pragmatic entry point. Now fully integrated into the Google ecosystem, the Charge 6 combines reliable sensors with a slim form factor that disappears on the wrist.
Google Algorithm Integration and Health Features
The Charge 6 received a meaningful hardware upgrade over its predecessor by incorporating machine learning heart rate algorithms borrowed from the Google Pixel Watch line. Fitbit claims a 60% improvement in tracking accuracy during intense activities like HIIT, rowing, and indoor cycling, an assertion backed up by real-world testing that shows far fewer dropouts during rapid cadence shifts.
Despite its modest price point, the Charge 6 includes advanced diagnostic tools:
- An integrated ECG app to check for atrial fibrillation.
- Electrodermal activity (EDA) sensors that detect micro-sweat responses to assist in structured stress management sessions.
- Continuous blood oxygen (SpO2) monitoring during sleep.
- Peripheral skin temperature variance reporting.
- Native integration with Google Maps turn-by-turn directions and Google Wallet via NFC.
The Freemium Hurdle
Fitbit’s primary compromise lies within its software. While basic metrics like step counts, daily active zone minutes, and current resting heart rate are accessible for free, deeper analytical layers—including historical HRV trends, detailed sleep score breakdowns, and the proprietary Daily Readiness Score—remain locked behind the Fitbit Premium paywall after the initial trial period expires.
Feature and Specification Comparison
The table below provides a structural overview of how these top five devices compare across their fundamental hardware and analytical parameters:
| Device | Primary Sensor Suite | Battery Life | ECG Available? | Subscription Required? | Best Suited For |
|---|---|---|---|---|---|
| Garmin Venu 3 | Elevate V5 PPG, Skin Temp, SpO2, Accelerometer | 10–14 Days | Yes (FDA Cleared) | No | Comprehensive health & active athletic lifestyle |
| Apple Watch Series 9 | Third-gen Optical, Electrical (ECG), Temp, Altimeter | 18–24 Hours | Yes (FDA Cleared) | No | iPhone users wanting medical accuracy & apps |
| Whoop 4.0 | 5 LEDs (Green, Red, IR), Skin Temp, EDA, Accelerometer | 4–5 Days | No | Yes (Monthly/Annual) | Athletes prioritizing recovery, strain, & sleep |
| Oura Ring Gen 3 | Arterial PPG (Green, Red, IR), Dual NTC Temp, Accel | 5–7 Days | No | Yes (Monthly) | Discreet sleep tracking, illness & cycle monitoring |
| Fitbit Charge 6 | Multichannel Optical PPG, SpO2, cEDA, ECG Electrodes | 5–7 Days | Yes (FDA Cleared) | Optional (Fitbit Premium) | Value-focused users wanting essential wellness data |
Optimizing Optical Sensor Accuracy: Avoiding Common Pitfalls
A fitness tracker’s data is only as good as the raw optical input it captures. Many users routinely draw inaccurate conclusions about their health due to improper sensor placement, environmental factors, or biological constraints.
1. Sensor Placement and Tension
The most frequent error is wearing the device too close to the wrist joint. The distal end of the ulna (the protruding wrist bone) creates an uneven surface that allows ambient light to leak into the photodiode, degrading signal-to-noise ratio. A tracker should sit approximately one to two finger-widths above the wrist bone, directly over vascular muscular tissue. The band should be snug: loose enough to avoid impeding venous return, but firm enough that the sensor maintains constant skin contact when you move your arm.
2. Vasoconstriction and Cold Weather
During cold-weather outdoor running or cycling, the body initiates peripheral vasoconstriction to preserve core temperature, shunting blood flow away from the extremities. With decreased dermal perfusion at the wrist, optical sensors struggle to detect alternating blood volume pulses. In winter conditions, warming up indoors first or wearing gloves that cover the wrist can significantly improve tracking accuracy from the start of an activity.
3. Melanin, Tattoos, and Skin Perfusion
Optical green light operates at a wavelength of roughly 525 nanometers, which is readily absorbed by melanin as well as hemoglobin. While modern algorithmic calibrations have significantly improved accuracy across varied skin tones, dark epidermal pigmentation can still attenuate the reflected optical signal. Tattoos present a far steeper obstacle: tattoo ink deposits in the dermal layer physically block and scatter the light path. If you have full sleeve tattoos covering your wrists, wearing the tracker on an un-inked portion of your body (such as the bicep via specialized strap) or utilizing a traditional electrical chest strap during training is generally required.
4. The Psychological Trap of Orthosomnia
As consumer sleep trackers have proliferated, sleep researchers have identified a clinical phenomenon termed orthosomnia: an unhealthy preoccupation with achieving optimal wearable sleep metrics. It is critical to recognize that commercial wearables estimate sleep stages based on movement and heart rate variability algorithms; they do not monitor electroencephalography (EEG) brain waves like a medical sleep lab.
If you wake up feeling energetic and clear-headed, but your wearable informs you that you only received 35 minutes of deep sleep, do not let the algorithm dictate your psychological state. According to clinical guidelines from the Sleep Foundation, sleep stage metrics should be tracked as rolling multi-week baselines rather than high-stakes single-night scores.
Data Literacy: How to Interpret Your Health Metrics
To convert raw wearable telemetry into meaningful behavioral changes, you must know which metrics warrant daily attention and which should be viewed only as broad context.
Heart Rate Variability (HRV): The Autonomic Balancing Act
HRV measures the variation in time (in milliseconds) between successive heartbeats, known as the interbeat interval (IBI). Contrary to common intuition, a healthy heart does not tick like a metronome. It accelerates slightly during inhalation (sympathetic branch activation) and decelerates during exhalation (parasympathetic branch activation via the vagus nerve).
A higher baseline HRV generally signals a resilient autonomic nervous system capable of adapting dynamically to physiological demands. However, comparing your HRV directly to a friend’s is counterproductive. HRV is highly individual, governed by genetics, age, biological sex, and posture. What constitutes an elite HRV for a 50-year-old (e.g., 45 ms) might be low for a collegiate athlete (e.g., 110 ms). Always track your personal rolling 7-day and 30-day baseline. A sustained drop below your established baseline often indicates impending overtraining, unmanaged psychological stress, poor metabolic choices, or latent illness.
Resting Heart Rate (RHR) Trends
Resting heart rate is your baseline cardiovascular efficiency gauge. As aerobic capacity improves through regular cardiovascular training, stroke volume increases—meaning the heart pumps more blood per beat, lowering the required beats per minute at rest. Tracking morning RHR provides immediate biofeedback: an uncharacteristic elevation of 4 to 7 beats above baseline upon waking is one of the most reliable indicators that your body is still processing physical trauma, fighting off an immune threat, or clearing alcohol from your system.
Calorie Burn Algorithms: Why You Should Ignore Them
One of the most heavily marketed features of modern fitness trackers is estimated energy expenditure (active calories burned). Multiple independent validation studies have revealed that commercial fitness trackers exhibit error margins ranging from 20% to over 40% when calculating dynamic calorie burn. Trackers estimate metabolic equivalents (METs) using demographic tables, accelerometer movement counts, and heart rate data, but they cannot measure actual thermal output or oxygen-to-carbon dioxide gas exchange.
Relying on wearable calorie burn figures to adjust your nutritional intake often leads to overeating. Use step counts and active minutes to gauge mechanical work volume, but treat specific calorie burn numbers purely as arbitrary index figures rather than literal thermodynamic facts. When planning your daily recovery fuel and meal preparation, focus on nutrient density and balanced choices like those found across wellness and fitness dietary approaches, rather than attempting to “eat back” the calories your watch claims you burned during an afternoon workout.
Choosing the Right Tracker for Your Specific Lifestyle
To select the ideal device, identify the primary problem you are attempting to solve rather than buying based on feature volume.
- Choose the Garmin Venu 3 if: You want deep athletic insights, an exceptional battery that lasts more than a week, and built-in ECG capabilities, without being saddled with an aggressive subscription model.
- Choose the Apple Watch Series 9 if: You already use an iPhone, desire peerless optical sensor precision during workouts, need proactive cardiovascular safety alerts (Afib screening), and do not mind a daily charging cadence.
- Choose the Whoop 4.0 if: You are an athlete periodizing heavy training blocks, prefer wearing no screens on your wrist, and want nuanced algorithmic guidance on systemic strain and sleep recovery.
- Choose the Oura Ring Gen 3 if: You want a discreet, screenless health monitor to track sleep architecture, body temperature, and illness trends, while wearing your own traditional analog watch.
- Choose the Fitbit Charge 6 if: You want a slim, cost-effective tracker covering basic metrics like steps, resting heart rate, and sleep staging alongside basic Google ecosystem conveniences.
Frequently Asked Questions
Are consumer fitness trackers accurate enough to diagnose heart conditions?
No. Consumer fitness trackers equipped with ECG capabilities are classified by regulatory agencies like the FDA as cleared for informational screening, specifically detecting the presence of atrial fibrillation or abnormal resting heart rate thresholds. They are single-lead equivalents, measuring electrical signals across your arms, whereas clinical diagnosis relies on 12-lead electrocardiograms that map cardiac electrical activity from multiple spatial angles. If your device alerts you to an irregular rhythm, export the PDF report and bring it to a physician for clinical evaluation, but never use a wearable to clear yourself of suspected cardiac symptoms like chest pressure or acute shortness of breath.
How long does it take for a tracker to establish an accurate personal baseline?
Most modern recovery algorithms require a minimum of 14 to 30 consecutive days and nights of wear to build a reliable physiological baseline. During the first two weeks, metrics such as HRV status, baseline skin temperature, and sleep need scores can fluctuate erratically as the algorithm calibrates to your circadian rhythms and typical activity levels. For best results, wear the device consistently through the night and avoid changing its physical placement on your body during this calibration window.
Why do two different trackers show different sleep stages for the same night?
Because wrist-based wearables cannot monitor brainwave activity directly, they infer sleep stages (Awake, Light, Deep, REM) by interpreting peripheral biological signals: movement intensity, heart rate deceleration, respiratory rhythm stability, and subtle HRV shifts. Every manufacturer utilizes different proprietary machine learning models trained on different reference datasets. As a result, the thresholds used by Garmin, Apple, and Oura to distinguish between Light and Deep sleep vary considerably. Focus on total sleep duration, sleep continuity (wake episodes), and multi-week trend lines rather than fixating on minor differences in estimated deep sleep percentages.
Is heart rate variability (HRV) useful if I don’t exercise heavily?
Yes. Heart rate variability is an index of total autonomic nervous system balance, not merely athletic conditioning. Psychological distress, chronic work stress, poor sleep hygiene, systemic inflammation, alcohol consumption, and nutritional strain all influence vagal tone. Tracking HRV allows non-athletes to observe how lifestyle habits directly affect systemic recovery, providing objective feedback on the physiological impact of evening screen time, late-night dining, or mindfulness interventions.
Will swimming or showering damage optical sensors?
Most reputable fitness trackers carry water resistance ratings of 5 ATM (water resistant to up to 50 meters) or higher, making them safe for pool swimming, open water workouts, and showering. However, hot water and soaps present separate concerns: high water temperatures in saunas or hot tubs can degrade silicone gaskets over time, while soap scum and shampoo can build up over the optical lens and charging pins, obscuring light transmission. If you wear your tracker in the shower or ocean, rinse it thoroughly with fresh water and dry both your skin and the sensor plate completely before latching it back onto your wrist.

3 thoughts on “Best Fitness Trackers Tested for Health and Wellness”
Comments are closed.